Advan Research
Login icon LOGIN
Simon is buying Taubman. How to quantify the synergies?

Simon is buying Taubman. How to quantify the synergies?

Usually the first considerations when a company acquires another is how to realize economies of scale, cross-marketing opportunities, and areas of common improvement. If one knew which shoppers visit each location and quantified the cross-visits between malls then they could make educated decisions about which malls to focus on for improvements, tenant acquisition, or cross marketing. With traditional measuring methods this is hard to achieve, but cellphone location data is the perfect fit for such an exercise.
2 minutes
Monitoring the coronavirus effects

Monitoring the coronavirus effects

Markets have reacted very strongly to the potential effects from the coronavirus epidemic in China. MGM, Las Vegas Sands and Wynn Resort stocks have been hit particularly hard, dropping 20% since the news, mostly on fears that their Hong Kong and Macau locations will see materially reduced visitors during the annual Lunar Year celebrations. But are the actual effects on business and travel what the market expects or is this an over-reaction?
2 minutes

Black Friday is Holding Strong, but not everyone benefits equally

Department Stores, Restaurants, Malls, all continue growing their traffic on Black Friday on a year over year basis. The growth rate has decelerated a bit, but it’s still in the healthy double-digit numbers, from an already high base. Only Hotels showed negative growth, but less so than in prior years – a weighted average of -1% vs -3% and -2% in 2018 and 2017 respectively. Below are a couple of graphs that illustrate the traffic.
3 minutes

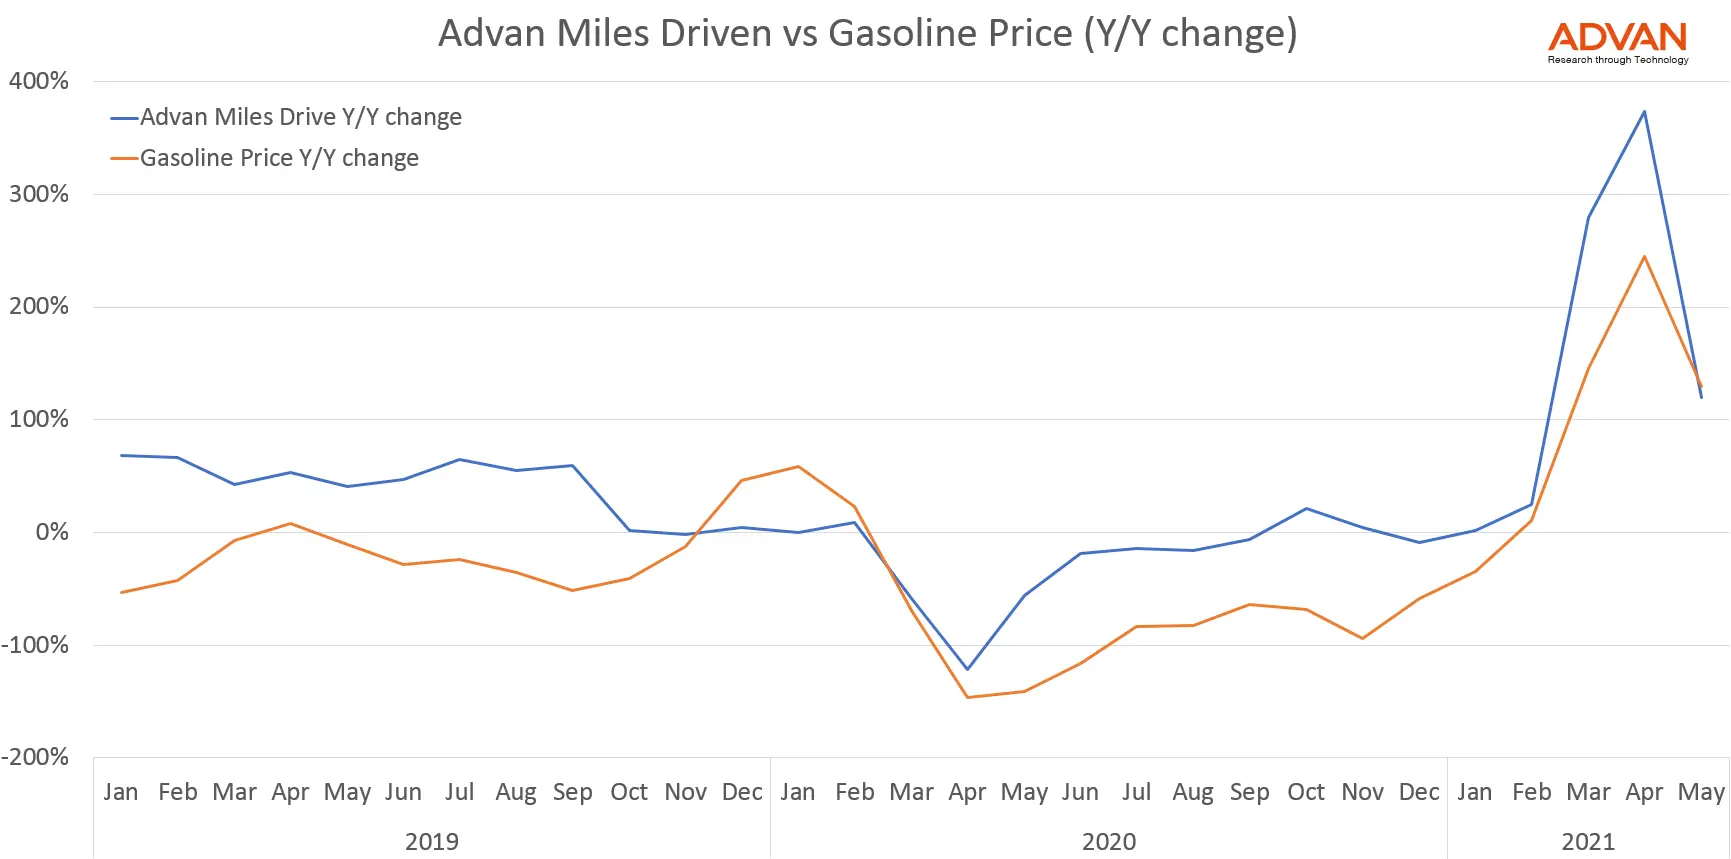
Miles Driven and Trucks Miles Driven: macro indicators

One of the interesting things you can do with access to anonymized, large scale and accurate cellphone location data, is to measure traffic patterns. Consistent with the Big Data theme, we decided to compute this across the whole US, to measure Total Miles Driven. Total Miles Driven is estimated by the Federal Government (aka “FRED”) in a monthly report, which is generated with about a 35 day delay (e.g., the September total miles driven is published in early November).
2 minutes

Freedom: priceless

It comes in many forms: Speech. Movement. Draw within the lines. Wait, scratch that last one. We didn’t like that last one either. When it comes to measuring foot traffic, trade areas, migration patterns, demographics, cross traffic, and in general get behavioral metrics from mobile location data, yesterday’s state of the art was to get canned results on some buildings or venues someone else has decided you might be interested in.
3 minutes

There’s no Season like Earnings Season

It is everyone’s favorite game to perfectly forecast earnings by looking in the rear view mirror. We are trying really hard not to fall into the same trap ourselves. Here is why: it is very easy to make random predictions, some of which come true, and then look back and cherry-pick the ones that you were right. Really, a monkey can do it. If you give them a banana for each correct prediction they would get pretty fat, fast!
2 minutes

Myths and Truths about Retailer performance

Is Gamestop’s traffic up? Is Jimmy John’s traffic growing more than Subway’s? Every day some new analysis of cellphone location data portrays to measure the exact foot traffic in one or all of these, and every day we emit a collective gasp at the incredulous claims. Let’s get this quickly out of the way: Gamestop traffic is trending down; Jimmy John is down too and that trend has not changed for 3 years straight; it’s also worse than Subway’s downward trend, except for some bright, but inconsistent, spots in 2019.
2 minutes